Creating a LiPD file
The most straightforward way to upload a dataset onto the wiki is to first create a LiPD file and upload it directly.
Contents
What is LiPD?
LiPD (Linked Paleo Data) is a convenient way to store and exchange paleoclimate data format and provides the backbone of the LinkedEarth edifice. LiPD is closely aligned with the LinkedEarth Ontology; changes in one are mirrored in the other.
How to read a LiPD file?
LiPD was designed so that is can capture much richer sets of (meta)data than ASCII or Excel files and to have a fixed backbone around which scientific codes can be built. There is a price to pay for this power: LiPD is undoubtedly more difficult to interact with than a plain text file. Although it is possible to unzip a LiPD file and navigate through the native JSON-LD and csv files, this not the best way to harness the power of LiPD files.
The easiest way to interact with a LiPD file is by using this very wiki, which allows you to navigate the hierarchical structure of the file easily.
In addition, we have developed several utilities to read and write LiPD files in Matlab, Python, and R.
What can I do with a LiPD file?
LiPD was designed to facilitate coding around paleoclimate data. We have already developed software in R and Python to analyze and visualize paleoclimate data:
In addition, CSciBox (an integrated system for age-model reconstruction) makes use of LiPD.
How do I get my data into LiPD?
As of April 2017, the most efficient way to get you paleoclimate dataset in LiPD format is to fill out our template (File:LiPDv1.2 template.xlsx) and use the Python LiPD Utilities to convert the template into a LiPD file. Make sure you are using the latest version of the template for compatibility.
By the end of 2017, a web-based interface should be able to automate a lot of the manual steps.
General Guidelines
What goes into a LiPD file?
This is a trickier question than it appears at first. Consider two extremes: (1) every little data table could have its own LiPD file; (2) we could try and squeeze all the paleo data generated thus far into one giant LiPD file. Where is the happy medium? There are two ways to think about this:
Study Level
All data and metadata that are part of the same study should be placed in the same LiPD file. There are exceptions to this rule of thumb. For instance, if the study involves two physical samples in drastically different locations (i.e., different regimes), then each physical sample and associated data and metadata should be placed in separate LiPD files. In other words, if the data from each specific physical sample can be reused on their own in another study, then each should be placed in its own LiPD files.
Signal Level
All the paleo data recording the same environmental signal (ii.e. having the same Category:Interpretation_(L)). Again, there are exception, such as studies done at the same site by different groups and very different points in time. Follow-up studies where one investigator goes back to the same site to expand the dataset (e.g. longer core/higher resolution sampling) probably warrants a new LiPD file, unless the results don't lead to any science, in which case it qualifies more as a "replication" study.
Examples:
All data and metadata should be in the same file for the following studies:
- Lake cores from the same lake
- Speleothems from the same cave
- Ice cores from the same hole
- Marine sediments from the same hole (IODP), same location (multi-core, piston core/gravity cores)
- Corals from the same head
- Trees from the same geographical region
- Lake cores from different lakes but with the same climate interpretation. For instance, a regional composite.
- Speleothems from different caves with the same climatology
Data and metadata should be in different files for the following studies:
- Speleothems from different caves in different monsoon regimes
- Lake cores from different lakes with different catchment basins
- Marine sediments with different oceanographic regimes
- Corals from different islands.
On the whole: there are no hard and fast rules, and feedback is welcome.
What constitutes a measurement table?
Simply put, one table/physical sample. So if a study uses two speleothems, the measurements for each sample should be reported in two different tables.
A good rule of thumb is to ask: How is the data going to be reused? For instance, if radiocarbon chronologies for different cores are meant to be independent of each other, then each physical sample should get their own measurement table. On the other hand, if a composite depth is used, then the measurements for each physical sample can be placed in the same table.
Excel Template
Download the template
Compatible with LiPD version 1.2: File:LiPDv1.2 template.xlsx.
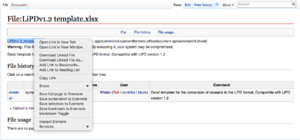
Right-click on the name of the file and select 'Download Linked File'.
General Instructions
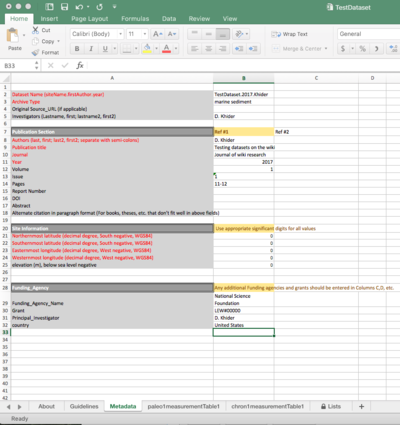
The template has three sheets: Metadata, paleo1measurementTable1, chron1measurementTable1. The sheet named "list" contains ontology information and should not be edited.
There should only be one Metadata sheet/dataset!
If you need additional measurement tables, create new sheets by copying the content from paleo1measurementTable1 to new sheet(s) and name them paleo1measurementTable2, paleo1measurementTable3,... or chron1measurementTable1, chron1measurementTable2,...
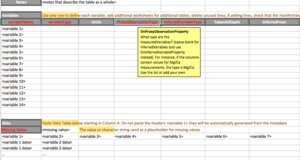
All the fields in red are mandatory for a LiDP file to be valid. if you're unsure how to answer a question, click on the cell and a yellow pop-up will appear with directions. All the terms used in the Excel template have formal definitions that can be found on this wiki. Use the search bar to access a definition of a term and examples on how the term was used.
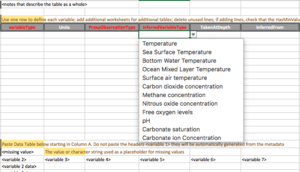
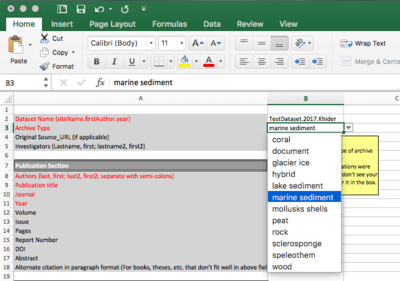
Some of the field are drop-down menu options:
- You may be required to choose something already on the list (e.g., variableType).
- In some instances, you can add your answer if it doesn't have an option (e.g., a new type of proxy observations).
If a dataset only contains inferred variables:
To make the data reusable by the community, we strongly encourage you to enter your raw measurements (Category:MeasuredVariable ©) along with its interpretation (Category:InferredVariable ©). However, we are aware that this may not always be possible. For instance, when transforming a legacy dataset into LiPD format, the raw measurements may not be readily available. However, the LinkedEarth wiki (and LiPD) requires a type of archive (e.g. marine sediment). On the wiki, the type of archive is only accessible through a Category:MeasuredVariable ©.
You may wonder why that is. After all, both Category:MeasuredVariable © and Category:InferredVariable © are a type of Category:Variable ©. However, remember that the LinkedEarth Ontology is designed to describe the relationship among the various categories. A measured variable is measured on the archive while the inferred variable is inferred from a measured variable.
Therefore, one needs to create the measured variable (a dummy one with no values if necessary) on the wiki.
Let's use a practical example. If the dataset you're working with only contains Sea Surface Temperature values and not the associated Sr/Ca data that the temperature inferred from, then create another column filled with the missing value flag for the datasets, using the Sr/Ca header. In the mediate section, only fill out the name, variableType ( measured or inferred), and ProxyObservationType for the variable (in this case, Sr/Ca).
If your table contains more than 14 columns, you can inset the corresponding lines for the metadata. Make sure you copy and paste the formulas from the previous lines!
Fill in as many fields of the template as possible. Future generations of researchers will thank you!
Step-by-step Instructions
Note: The dataset used for the instructions is a dummy dataset. None of the values were measured.
Remember all the fields in red are mandatory.
Metadata
The Metadata sheet contains the metadata pertaining to the entire dataset.
- Dataset Name: The standard notation used on the LinkedEarth wiki is siteName.firstAuthor.year.
- ArchiveType: The type of proxy archive on which the measurements were made. This automatically set the Category:ProxyArchive © to the proper type.
- Original Source_URL: If the data is also stored on NOAA, PANGEA, or with the original publication, enter the URL
- Investigators: This corresponds to the contributors on the wiki. Enter the name of anyone who has contributed to the creation of the dataset, including the authors on the publication or lab technicians involved in the study.
- Publication Section:
- Authors: The authors of the publication.
- Publication title: The title of the publication.
- Journal: The journal title in which the publication appears.
- Year: The year the publication was published. Can be different from the year in which the dataset was published/created.
- Volume: The volume in the publication.
- Issue: The issue in the publication.
- Pages: The range of pages in the publication.
- Report Number: The number of the report, if applicable.
- DOI: The DOI of the publication.
- Abstract: The abstract of the article.
- Alternate citation in paragraph format: For books, any publication that don't fit well with the above format.
- Site Information:
- Northernmost latitude (decimal degree, South negative): The wiki uses a more sophisticated approach for Category:Location ©. Enter the northernmost latitude of your site in the Excel template first, then make appropriate correction directly on the wiki.
- Southernmost latitude (decimal degree, South negative)
- Easternmost longitude (decimal degree, West negative)
- Westernmost longitude (decimal degree, West negative)
- elevation (m), below sea level negative
- Funding Agency:
- Funding Agency Name: The name of the funding agency.
- Grant: The grant number.
- Principal Investigator: The principal investigator on the grant.
- country: The nation that funded the study.
Measurement Tables
By default, the Excel template contains sheets to enter a measurement table for the paleo information and one for the chron information. As mentioned in the general instructions, you can add as many measurement tables as necessary.
The step-by-step guide below uses the PaleoData information. The table for the chron information is virtually identical.
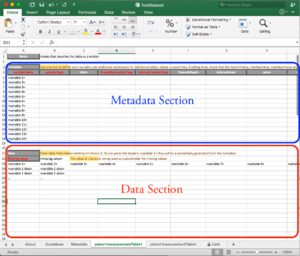
The Excel sheet is organized in two sections:
- The top portion is reserved for the metadata associated with each variable
- The bottom portion contains the data, with appropriate headers.
Data
Copy and paste your data starting in column A. The first row corresponds to your column header (variableName). Make the name human-readable and as precise as possible. Don't forget to enter the missing value flag! We recommend using NaN.
Metadata
Each row corresponds to the metadata associated with each of the column in the data table. If your data table contains more than 14 variables, you can insert lines below <variable14>. Make sure you copy and paste the formulas from the previous lines!
- variableName: The name of the variable. It is automatically lifted from the column headers.
- variableType: Use the drop-down menu to select either measured or inferred. This is required information to set the proper page category on the wiki (and therefore associated property).
- units: The units in which the variable is expressed.
- ProxyObservationType: If the variable is measured, select the type of proxy observation the variable belongs to. The drop-down menu contains the Category:ProxyObservation © already in the LinkedEarth Ontology, where you can provide a definition for the new term. If your variable is a new type of observations, enter it in the box. This will automatically create the concept in the LinkedEarth Ontology. Although this property may seem redundant with variableName, think about it from a computer perspective. Let's take the concrete example of a variableName set to G. ruber Mg/Ca. There are actually two pieces information in the name: 1. The ProxyObservationType, which is Mg/Ca in this particular example, and 2. The Category:ProxySensor ©, which is Globigerinoides ruber in this example. A human can make sense of the two pieces of information; this is why we are asking for a variableName in human-readable form. However, the computer needs to place the two pieces of metadata in difference categories.
- InferredVariableType: If the variable is inferred, select the type of inferred variable (for instance, Sea Surface Temperature). The drop-down menu contains the various types of inferred variables already in the LinkedEarth Ontology. If your variable is a new type of inferred variable, enter it in the box. This will automatically create the concept in the LinkedEarth Ontology, where you can provide a definition for the new term.
- TakenAtDepth: The wiki links each variable with an appropriate depth column using the Property:TakenAtDepth ©. The drop-down menu will automatically populate with the available variable name. Select the most appropriate column for depth information (if any). If multiple depth are reported, select one in the Excel menu. You can add more on the wiki directly.
- InferredFrom: This property links the inferred variable to the measured variable from which it has been derived. If the actual values of the measured variable are not provided (for instance, in the case of a legacy dataset), add a dummy column in the DataTable as explained in the general instructions.
- notes: notes regarding the specific variable. Notes pertaining to the entire measurement table should be entered on the first row of the Excel sheet.
- Interpretation: The Interpretation category allows to describe the phenomena that drove the variable.
- Interpretation1_variable: The name of the Interpretation variable. For instance, the measured variable Mg/Ca is interpreted as Temperature. In the LiPD framework (and by extension LinkedEarth wiki), an inferred variable.
- Interpretation1_variableDetail: Gives detail about the variable. In the Mg/Ca example, the variableDetail is 'sea surface'.
- Interpretation1_rank: If a variable has two (or more) possible interpretations, this property allows to rank them by importance. For instance, the D18O of coral aragonite can be interpreted both in terms of Sea Surface Temperature and sea surface D18O.
- Interpretation1_basis: the DOI of a publication with a relevant quote about the interpretation of the variable.
- Interpretation1_local: Is the interpretation local or far-field? Choose one in the drop-down menu or leave blank.
- Interpretation1_interpDirection: Part of the interpretation metadata that describes whether the interpreted environmental variable increased (positive) or decreases (negative) as the measured variable or inferred variable increases. Pick either positive or negative in the drop-down menu.
- Interpretation1_scope: Part of the interpretation that describes whether the interpretation relates to climate (e.g., Temperature), isotopes (e.g., D18O of precipitation), or ecology. Select one from the drop-down menu or enter a new one.
Note: To add an additional interpretation, copy and paste the headers modifying them to Interpretation2_variable, Interpretation2_variableDetail, Interpretation2_rank, Interpretation2_basis, Interpretation2_local, Interpretation2_interpDirection, Interpretation2_scope... Then copy and paste the formulas for the drop-down menus.
- Calibration: The calibration section allows to enter information regarding how the measured variable is transformed into the inferred variable.
- calibration_equation: The mathematical equation used in the calibration. For instance, if using the Anand et al. (2003) [1] general equation, enter Mg/Ca = 0.38exp(0.09T).
- calibration_notes: notes about the calibration equation.
- calibration_reference: The DOI of the publication in which the calibration appears.
- calibration_uncertainty: The value of the uncertainty associated with the calibration.
- calibration_uncertaintyType: The type of uncertainty (e.g., RMSE).
- sensorSpecies: For organic proxy sensor such as foraminifera, trees, mollusk, etc..., the species name.
- sensorGenus: For organic proxy sensor such as foraminifera, trees, mollusk, etc..., the genus name.
Converting to LiPD
As of April 2017, the conversion to a LiPD file needs to be done in Python (a free, open-source computing language). Note that only versions >= 3.5 are supported.
Installing the Python LiPD utilities
In a terminal window, type:pip install lipd
For more information about how to use the utilities, visit the GitHub page.
Running the Python LiPD utilities
Open your favorite Python interface (we recommend the use of Spyder, which comes with the Anaconda Python release) and type
#Import the package
import LiPD
#The following command will trigger a GUI to navigate to the Excel file. If you know the path, you can enter it directly in the parenthesis (using quotes)
lipd.readExcel()
#Create your LiPD file
lipd.excel()

#Validating your file.
#The following command trigger a GUI to navigate to the newly created LiPD file. If you know the path, you can enter it directly in the parenthesis (using quotes)
lipd.readLiPD()
#The following command will validate your file to make sure that it's conformed to the LiPD requirements. If the validation step failed, make sure that all the fields in red have been completed.
lipd.validate()
References
- ↑ P Anand, Elderfield, H., Conte, M.H. (2003) Calibration of Mg/Ca thermometry in planktonic foraminifera from a sediment trap time series. Paleoceanography, 18 (2), 1050, doi:10.1029/2002PA000846
